This set of maps was created for student presentations in GEOG 353 - Geography of Virginia in Fall 2010. Students gathered most of the data, primarily from USDA/NASS's Quick Stats online compendium of recent agricultural census data, tables from the 2007 Census of Agriculture for Virginia localities, and the Virginia Annual Statistical Bulletin. Where students gathered the data, all efforts have been made to double-check their work, but I do not guarantee the data is accurate and correctly applied to localities. All maps were prepared (rather quickly) by myself in MapInfo Professional 6.0 using a base map I digitized in 1998. Because students' presentation were set for an eight to nine minute length, most maps have layered two variables per map. Data sets were chosen more for their usefulness in revealing patterns of distribution than anything else. Because of disclosure regulations, statistics concerning acreage, production, and value that might reveal individual producer/farm statistics routinely are withheld by reporting agencies (and represented by the diagonal "Present, not disclosed" pattern); where disclosed data is severely limited, number of farms is substituted for use in the choropleth map patterns. Color choice was left up to the students. Questions about or suggestions for improving the maps should be addressed to me.
Dr. David S. Hardin
December 3, 2010
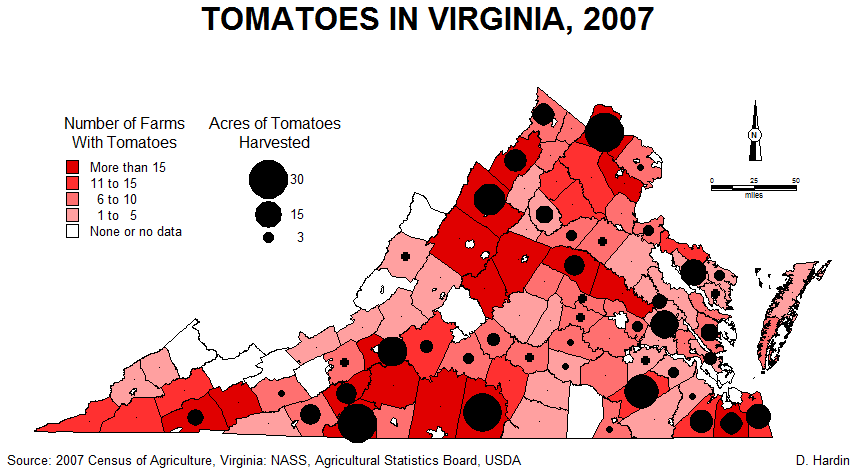
Tomatoes in Virginia, 2007 - Map of the number of farms with and acres harvested of tomatoes
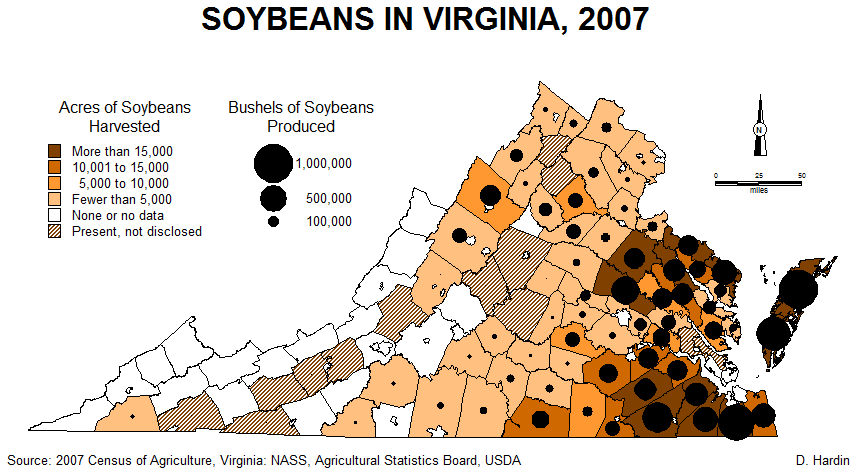
Soybeans in Virginia, 2007 - Map of acres harvested and bushels produced of soybeans
Marijuana in Virginia, 1998-2009 - Map of the annual average arrest rate per 100,000 people (1998-2000) and the number of marijuana plants seized in aerial eradication efforts (2003-2009)

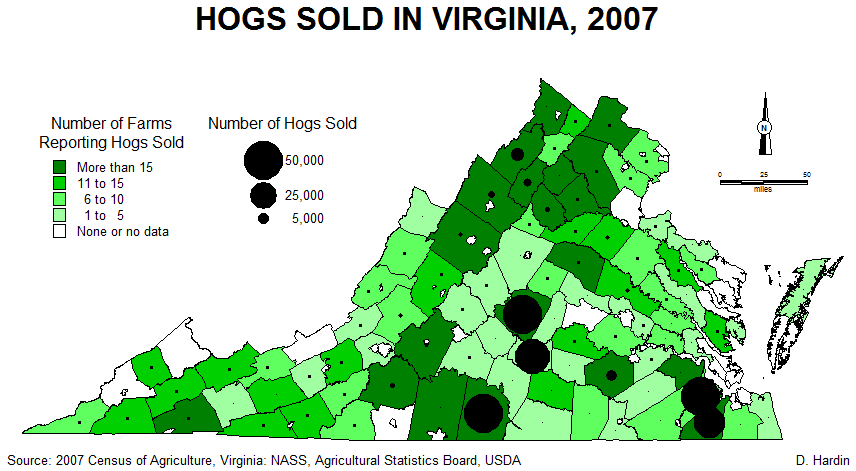
Hogs Sold in Virginia, 2007 - Map of the number of farms selling and number sold of hogs
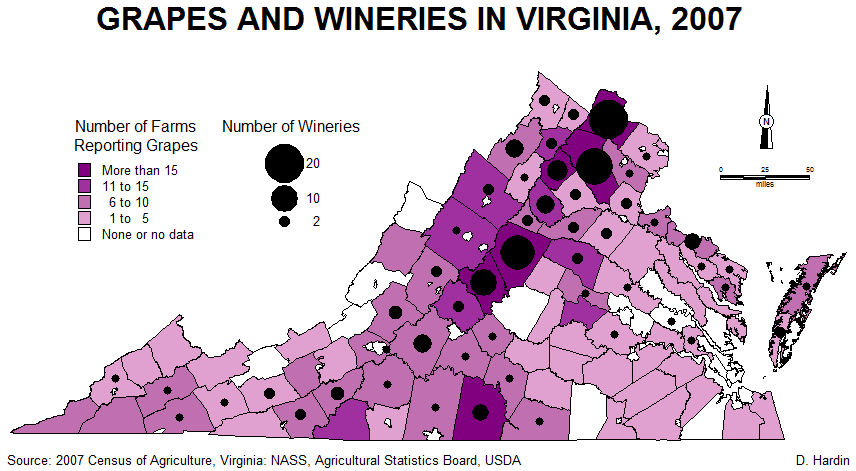
Grapes and Wineries in Virginia, 2007 - Map of the number of farms with grapes and the number of wineries
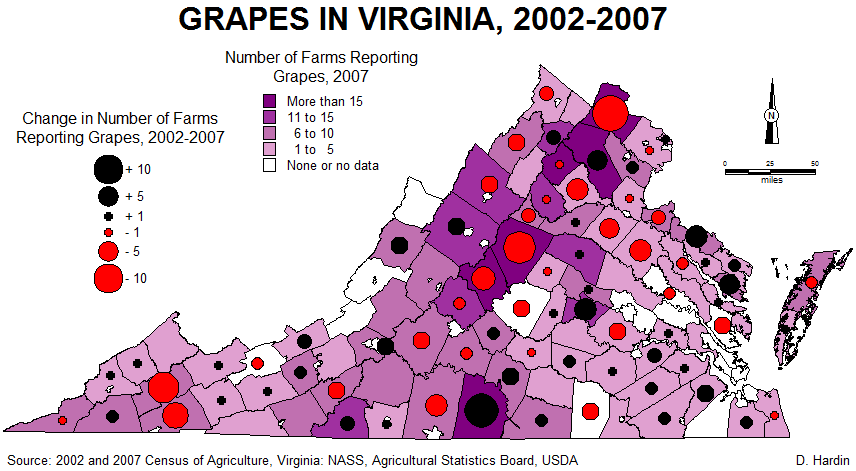
Grapes in Virginia, 2002-2007 - Map of the change in number of farms (2002 to 2007) and number of farms with grapes (2007)
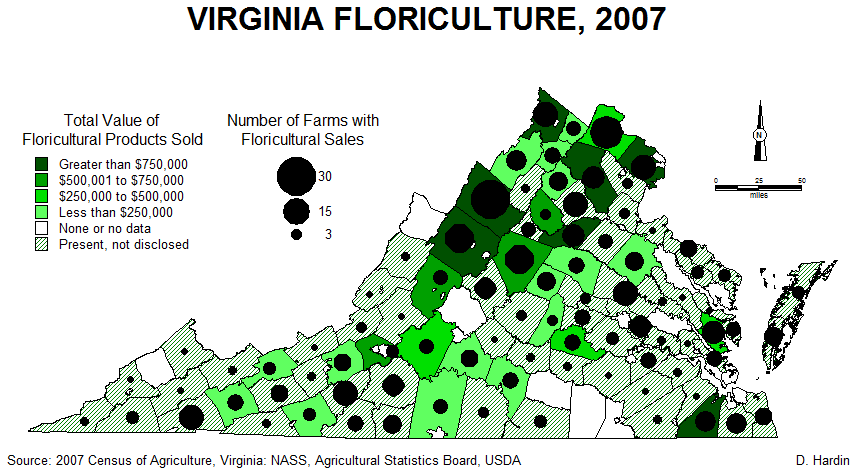
Virginia Floriculture, 2007 - Map of the total value of floricultural products sold and number of farms with sales
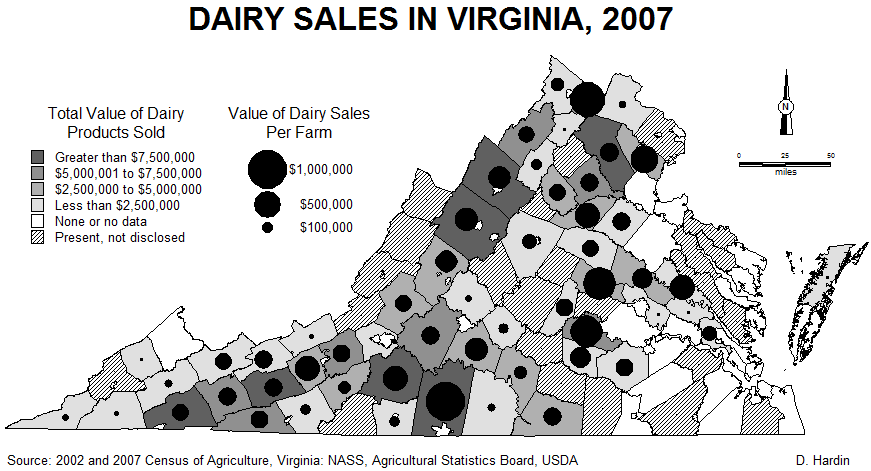
Dairy Sales in Virginia, 2007 - Map of the value of dairy products sold and dairy sales per farm
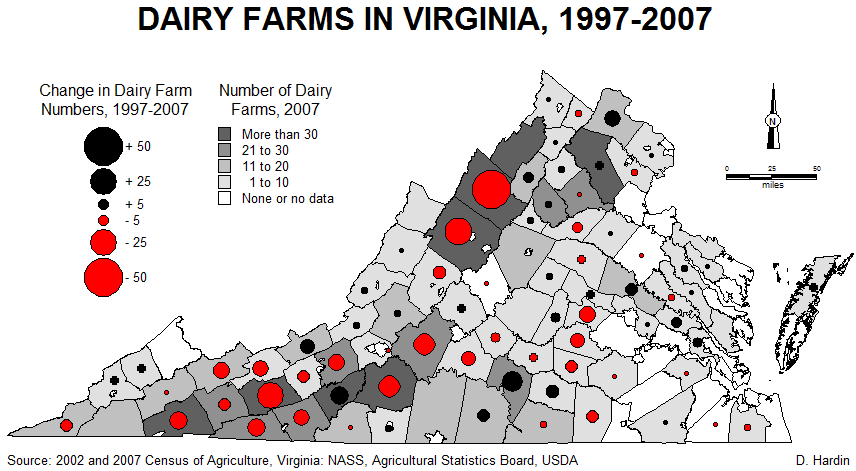
Dairy Farms in Virginia, 1997-2007 - Map of the change in the number of dairy farms (1997 to 2007) and the number of farms (2007)
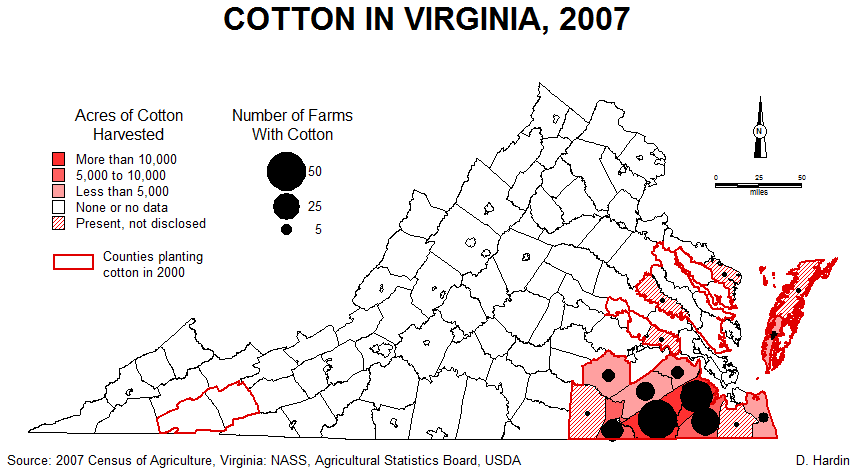
Cotton in Virginia, 2007 - Map of acres harvested, number of farms, and counties planting cotton in the peak year of 2000
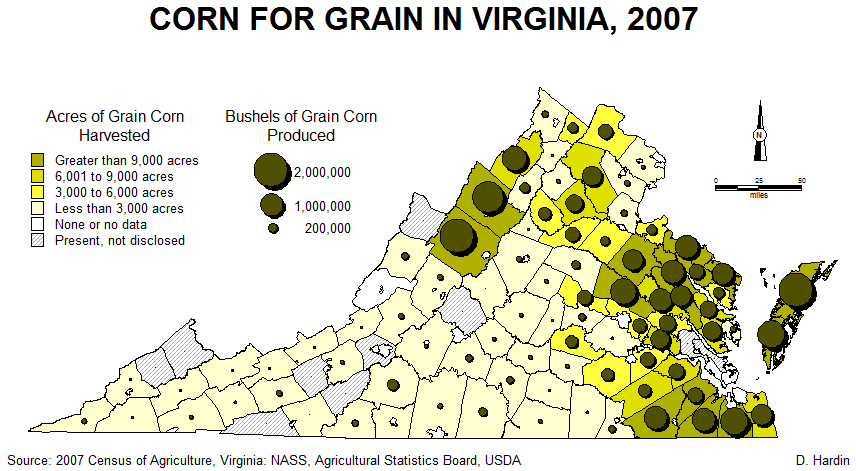
Corn for Grain in Virginia, 2007 - Map of acres harvested and bushels produced of corn for grain
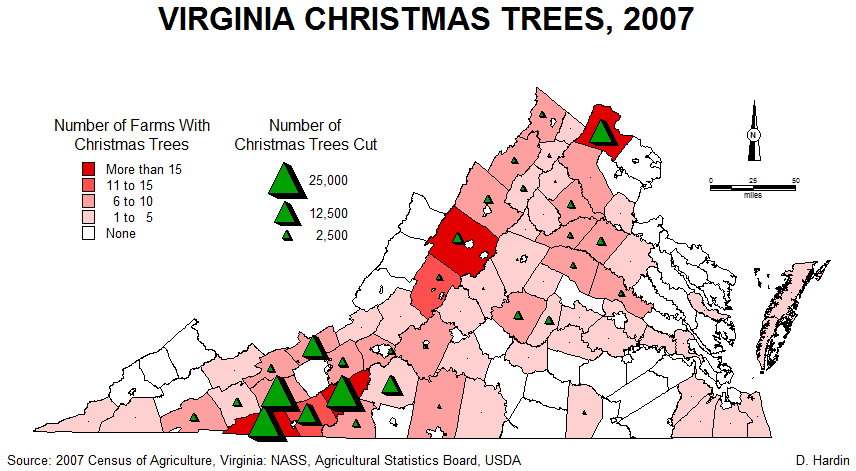
Virginia Christmas Trees, 2007 - Map of the number of farms with Christmas trees and number of trees cut
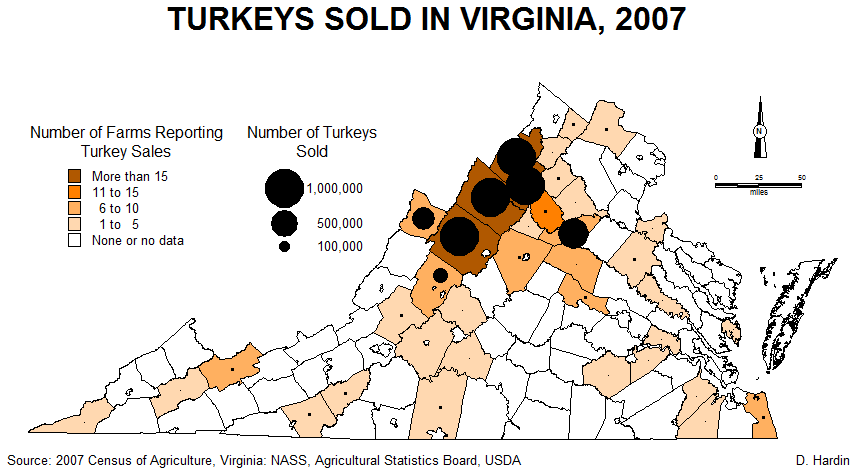
Turkeys Sold in Virginia, 2007 - Map of the number of farms selling and the number of turkeys sold
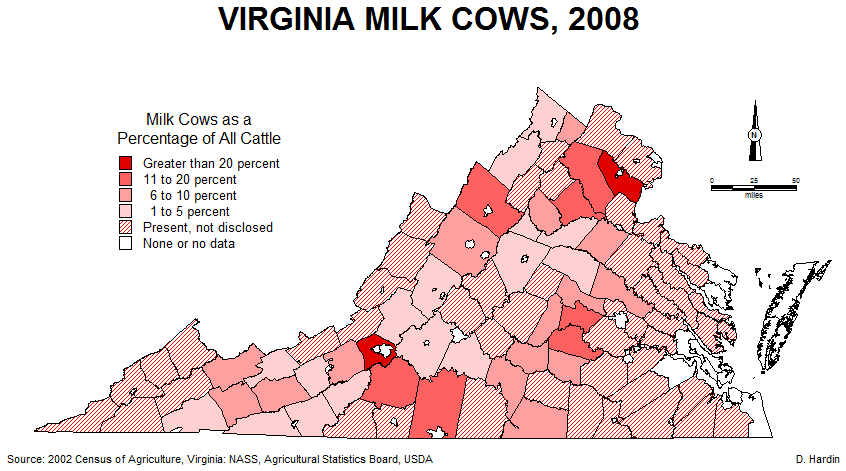
Virginia Milk Cows, 2008 - Map of milk cows as a percentage of all cattle
All maps copyright David S. Hardin
Maps may be used for non-commercial purposes with permission and proper citation
Updated December 3, 2010