ELECTION
PROCESS
2008
RESULTS
NOVEMBER 4, 2008
National

Obama
365
McCain 173
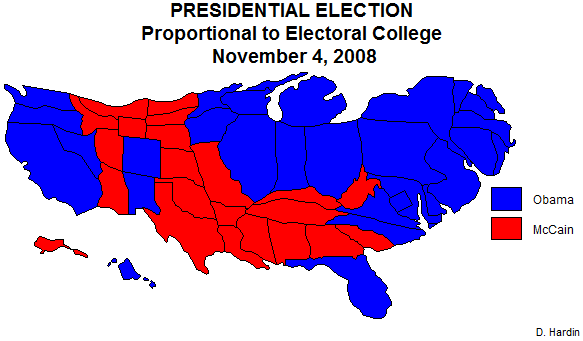

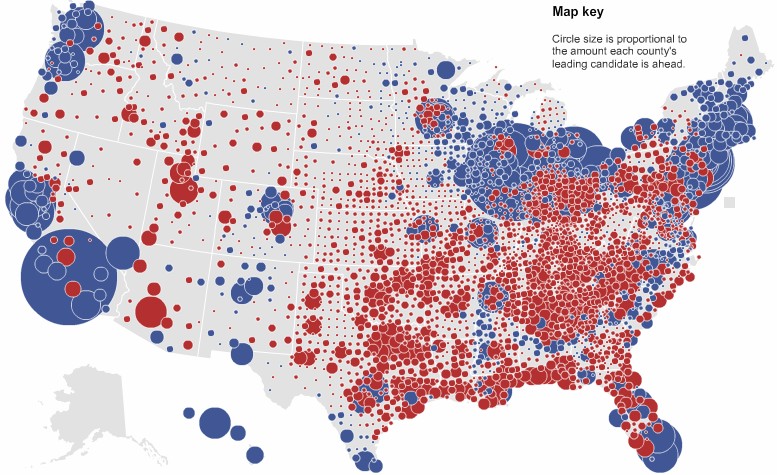
Above two maps courtesy New York
Times (http://elections.nytimes.com/2008/results/president/map.html)
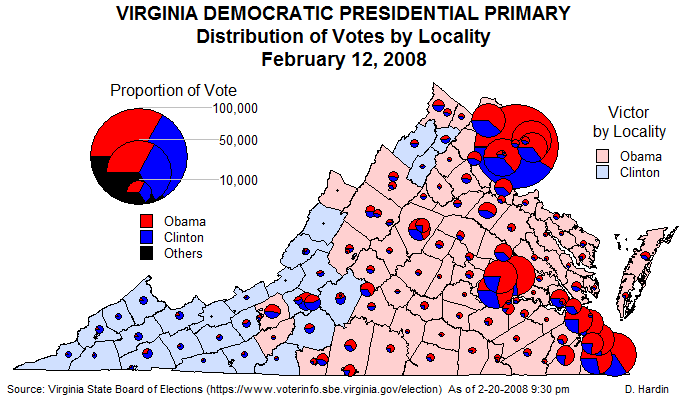
Virginia
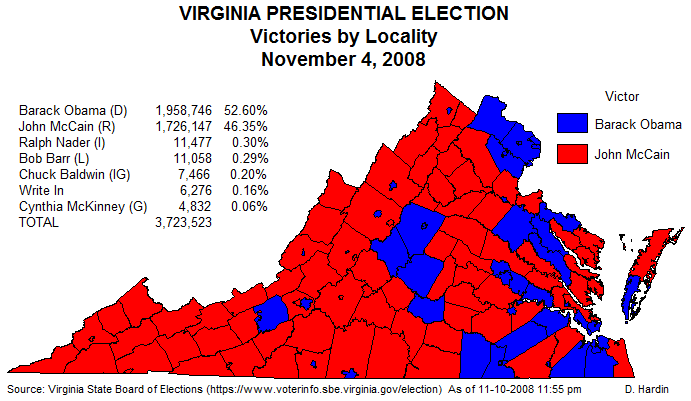
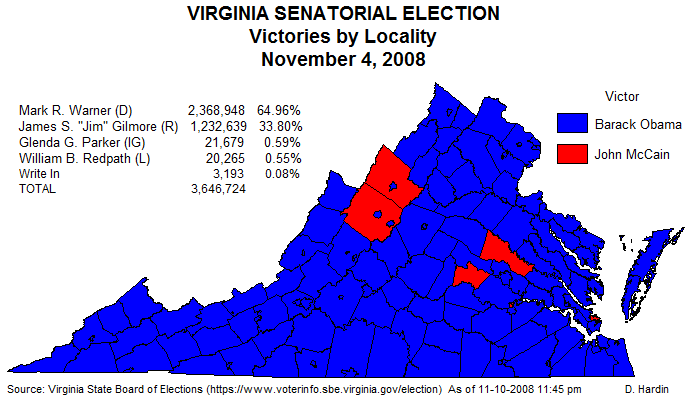
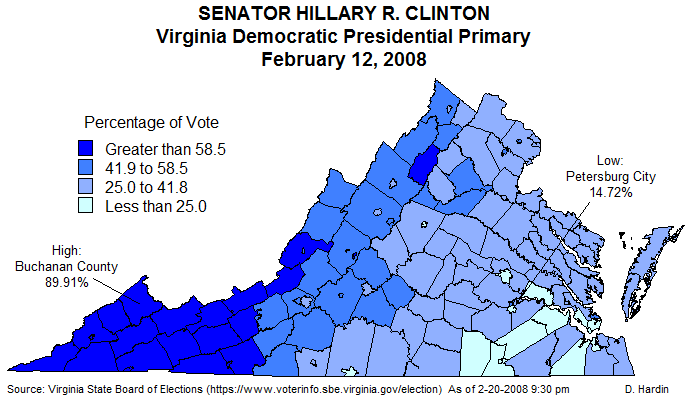
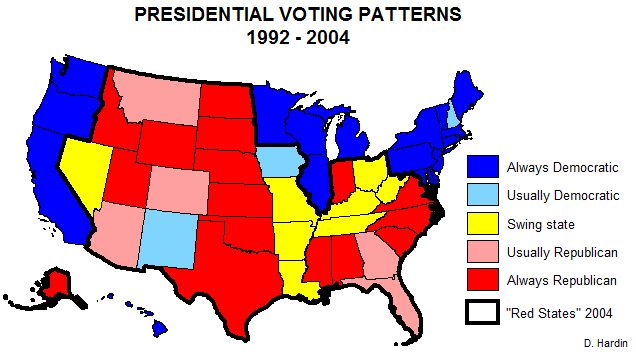
What Does the "Real Virginia" Look Like?
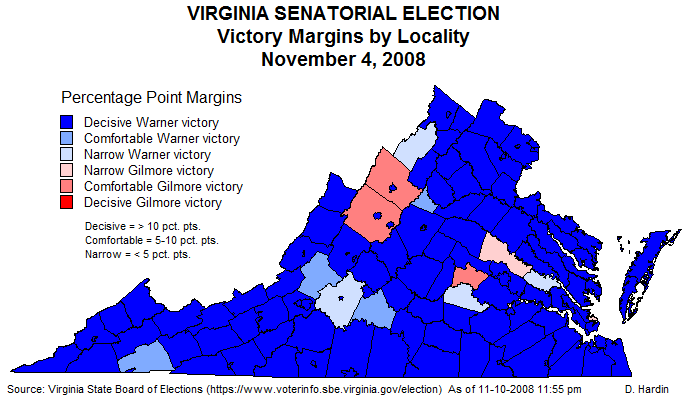
Virginia has experienced a profound political
transformation since 1964 - the last year the Old Dominion voted for a Democrat
for president. 1964 was the last year in which it could be said
Virginia was a Democratic state. The upheavals of the Civil Rights
movement and Massive Resistance had not yet transformed the state from majority
Democratic to majority Republican. The great switch was complete by the
1970s, when most white suburban and rural voters became Republicans and urban
and non-white voters became Democrats. That is what created the pattern you
see on the map above. Cities and those counties with large
African-American percentages (Caroline, King and Queen, James City, New Kent,
and the cotton/peanut counties south of the James) and union populations (coal
country, the Appalachian mill counties, Roanoke, and Danville) were the few dependably Democratic
localities until the 1980s.
Two changes that have accelerated since the 1980s
have been the growth of the "Golden Crescent" urban/suburban I-95/I-64 corridor
and the academic islands surrounding Virginia's universities. It may be
hard for some people to grasp, but even "Commie Country" Northern Virginia
(NOVA) was
overwhelmingly Republican until the 1990s. Large influxes from northern
states - not the District of Columbia, as one McCain surrogate who lives in
Oakton tried to assert - into Fairfax, Loudoun, and Prince William have made
those three counties increasingly purple. Note that I did not say blue;
only Arlington and Alexandria are solid blue and Democratic support decays with
distance from them. As anyone who is from NOVA can tell you, when it comes
to immigration into the National Capital Region, more liberal-leaning migrants
gravitate toward the Maryland suburbs while the more conservative and Southern
migrants tend to gravitate toward NOVA. Manassas and Manassas Park are the
only dependably Republican islands among purple outer suburbs. In the
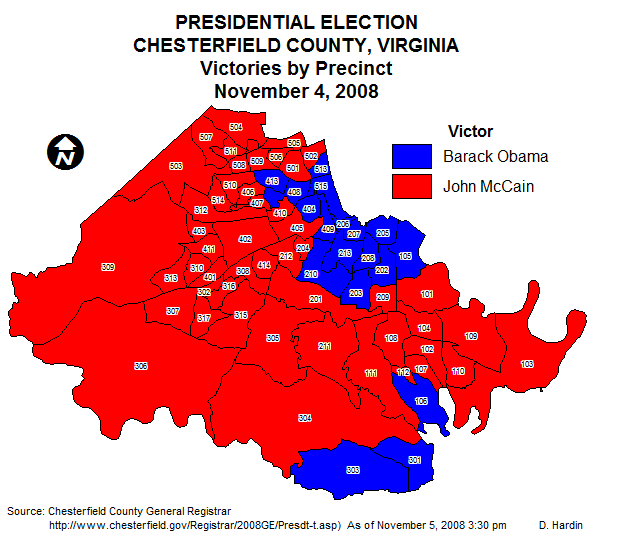
Richmond area, Yankee immigration has weakened the Republican hold on the
surrounding suburban counties, but aside from Henrico and its more moderate west
end, suburban Richmond has remained dependably Republican. Hampton Roads is a deceptive
region because of the collections of independent cities there. Suffolk,
Chesapeake, and Virginia Beach may be "cities,' but in size and suburban quality
they are like other counties, trending more conservative the farther from
Norfolk and Portsmouth that you go. All three are usually - just not
dependably - Republican, in part because of the overwhelming influence of active
and retired military there. Chesapeake in particular is a bellwether for
Republicans and Democrats alike, because whoever takes Chesapeake is most likely
to win an election in Virginia. Academic islands around the University of Virginia
(Albemarle, Nelson, and Fluvanna), Virginia Tech (Montgomery), and Longwood
University/Hampden-Sydney (Prince Edward) have recently come into their own,
tipping their surrounding counties into the blue column in at least one out of
the three elections since 2000.
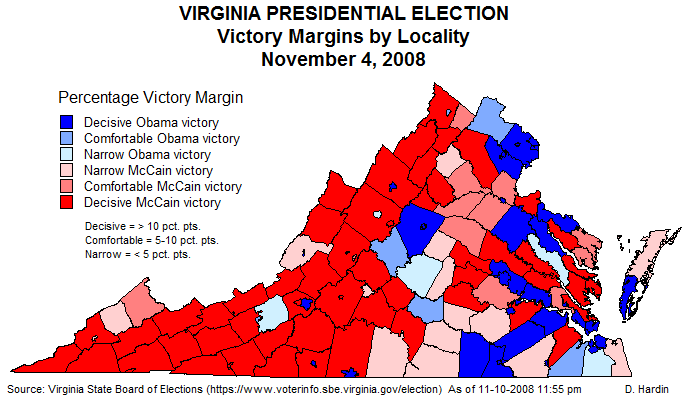
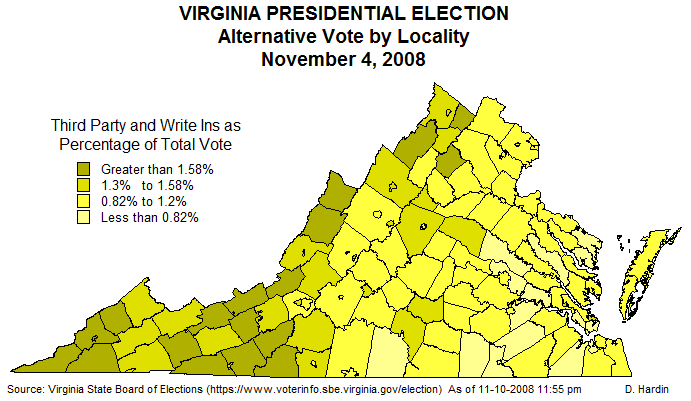
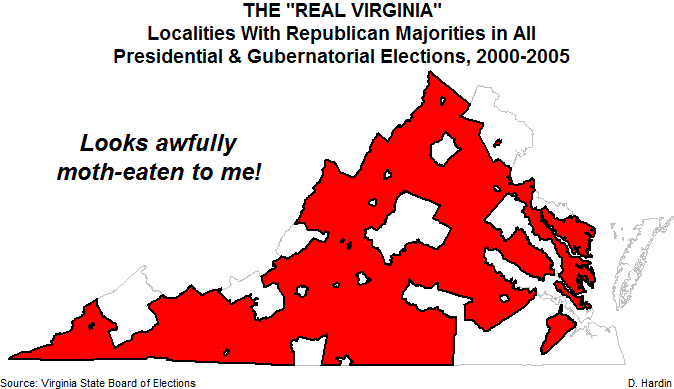
If one uses the definition hinted at by the now
infamous "real" Virginia remarks that came out of the McCain campaign - that
only those places that vote Republican and are "more Southern" are "really"
Virginia - then the real Virginia is looking awfully moth-eaten. Any
state-wide candidate in Virginia who believes he or she can win the state just
appealing to the red bits will be sorely disappointed. With northern
immigration, the "southern" nature of Virginia is on the decline. Where
once the Occoquan River formed the northern shore of the South, today it is
temporarily holding at the Rappahannock River - for how much longer, who can
say? Understanding that Virginia is becoming more "Mid-Atlantic" than
southern is one of the keys to surviving a state-wide run. With the rise
of dominance of the Golden Crescent, which is the southern leg of the
Megalopolis urban complex, populations have shifted so that control of Virginia
politics shifted from the rural areas to the urban/suburban areas in the late
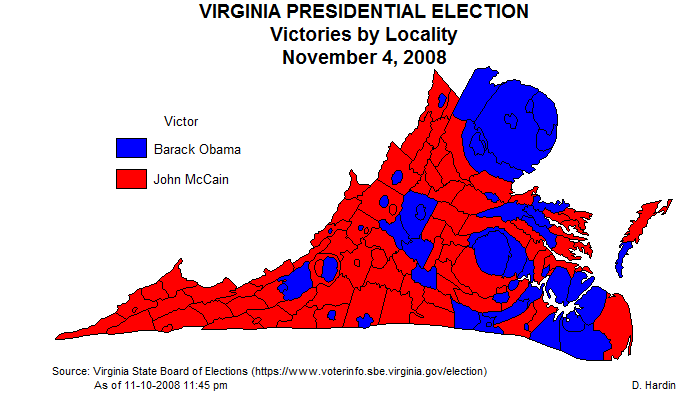
1980s and never will go back. When a map of the red bits is scaled
according to population (below; this is a type of map known as a cartogram), it
becomes clear how little of Virginia's total population is represented by the
red bits. As a result, in Virginia it is the Democratic star that is on the rise.

Created October 28, 2008
Updated October 30, 2008
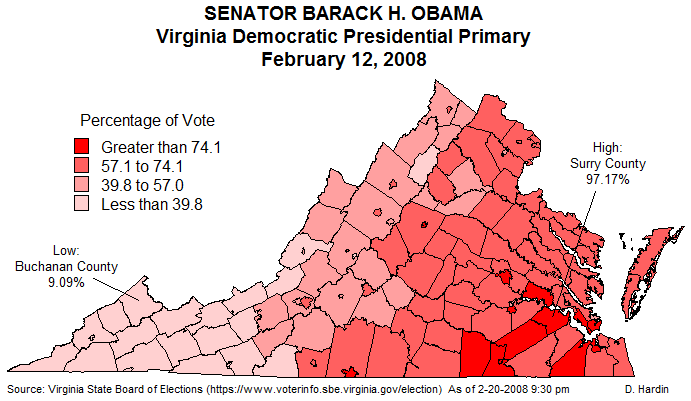
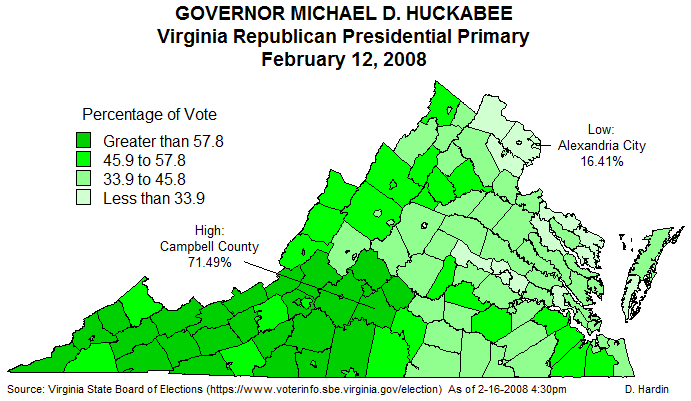
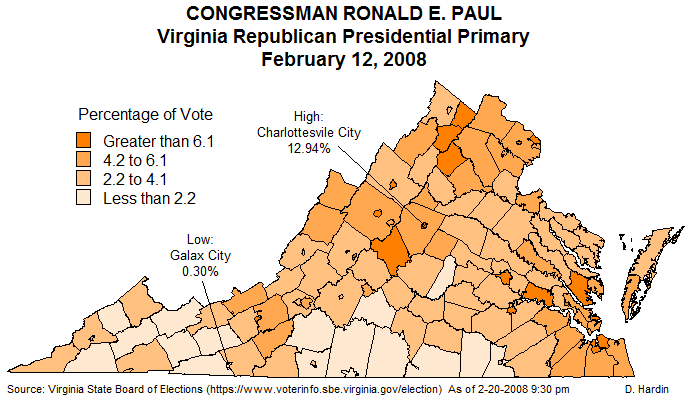
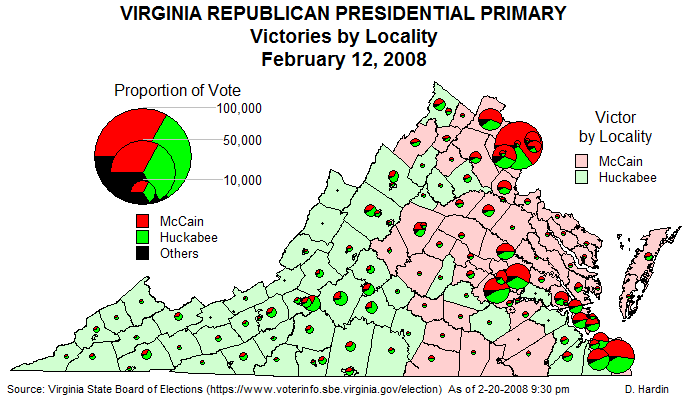
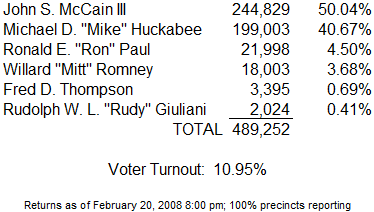
Chesterfield County
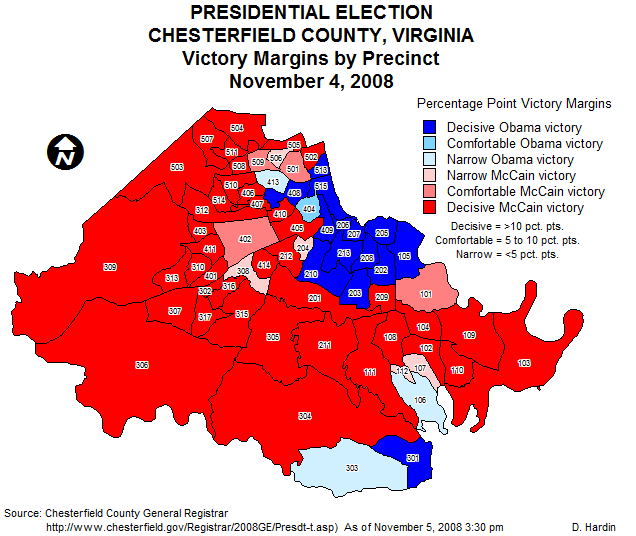
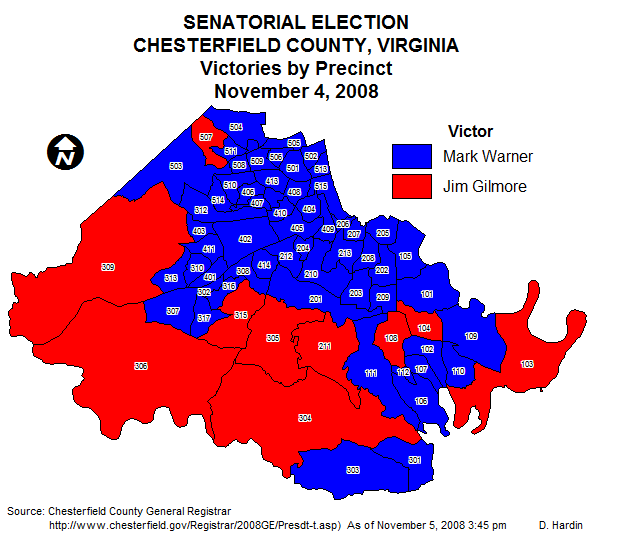
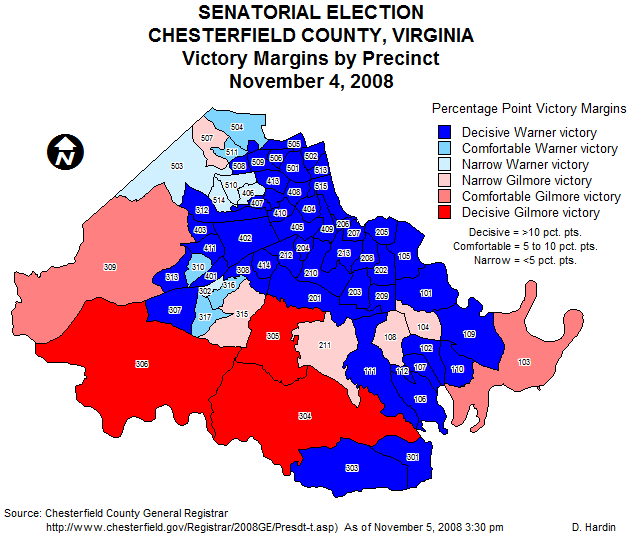
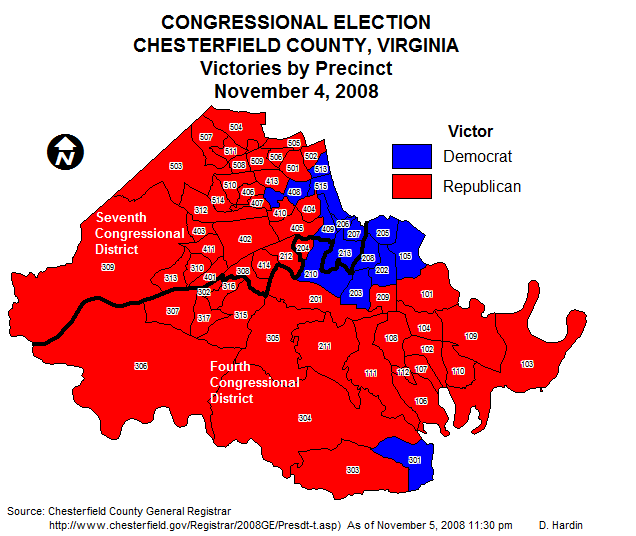

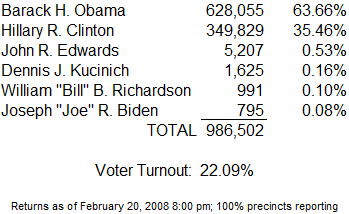
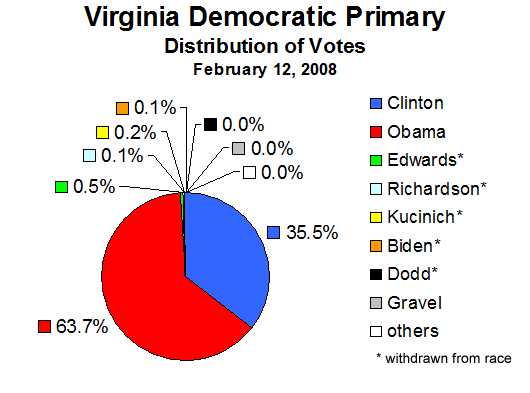
Virginia
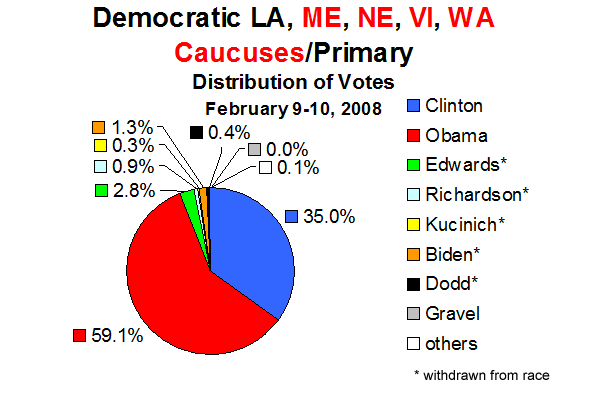
Primaries
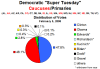
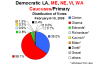
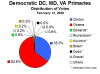
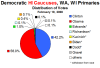
February 12, 2008


NATIONAL
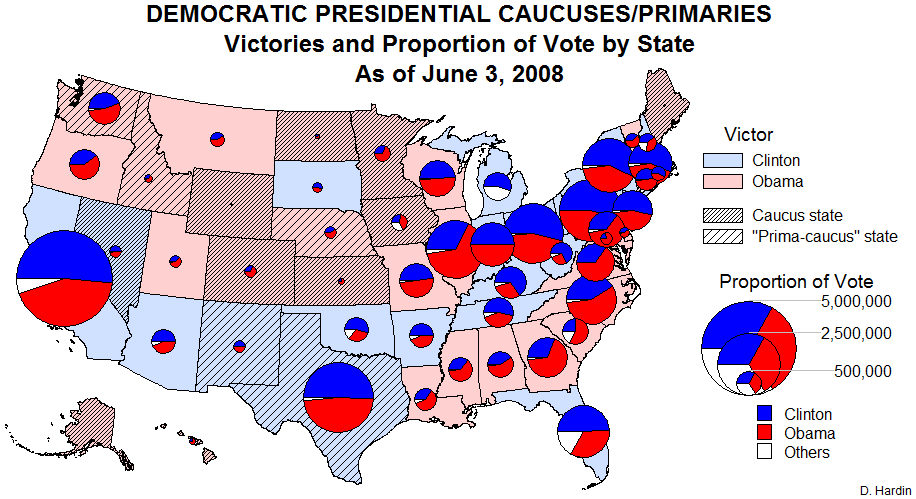
Presidential Caucuses/Primaries
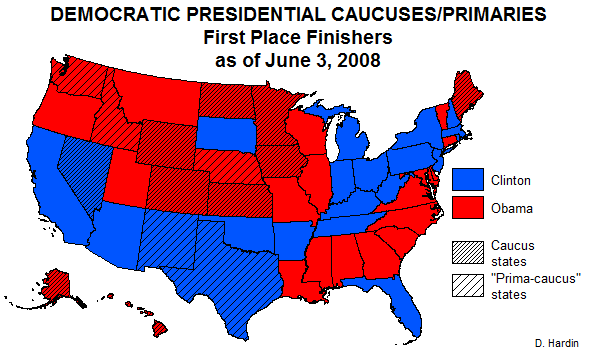
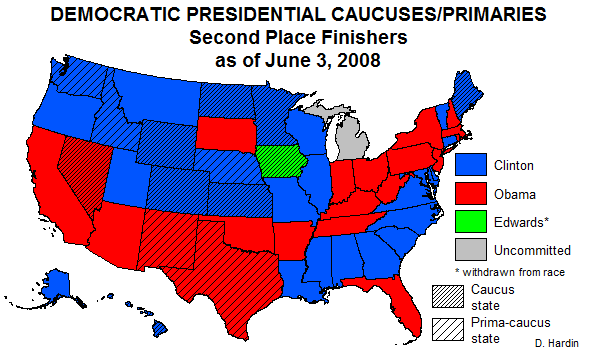
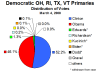
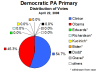
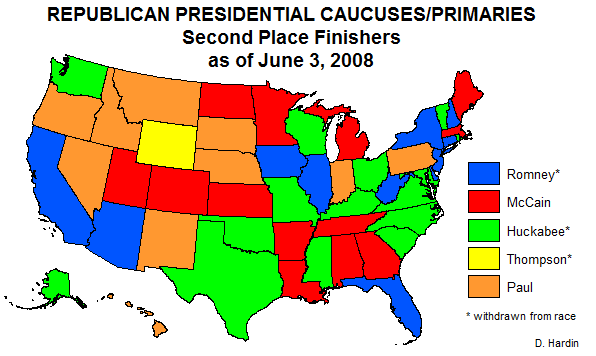
The primary maps below show both the
first place and second place finishers by state. Because
there is a very definite pattern to the victories Barack Obama
has been running up over Hillary Clinton, the most recent
Democratic primary maps include cross hatching to indicate those
states which have held caucuses rather than primaries. All maps are
created using MapInfo 6.1 and further processed using Adobe
Photoshop 4.0 LE.
All vote totals are drawn from
official state and party sources when at all possible.
Otherwise, data is drawn from provisional numbers reported by
the New York Times' "Election Guide 2008: Primary Season
Election Results" (http://politics.nytimes.com/election-guide/2008/results/votes/index.html).
Where there are discrepancies, official sources always are given
primacy. Delegate tallies are drawn from the Green Papers
"General Election USA 2008" (http://www.thegreenpapers.com/).
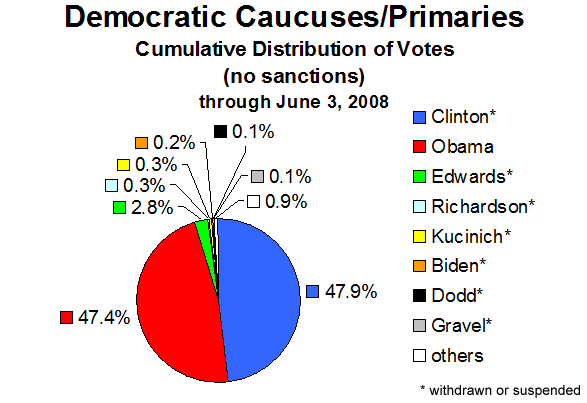
Although there are several ways to count delegates, I have
chosen to report all of the delegates won - regardless of
sanctions. That means Michigan and Florida delegates are
counted for Hillary Clinton.
David Hardin, February 13, 2008
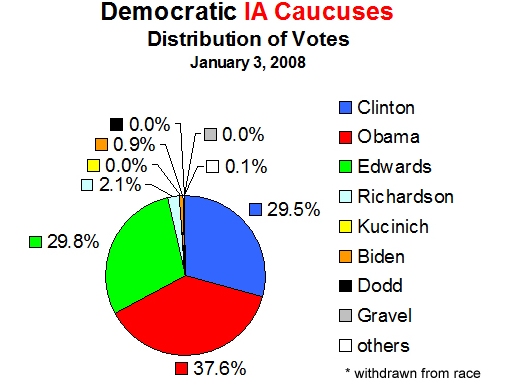
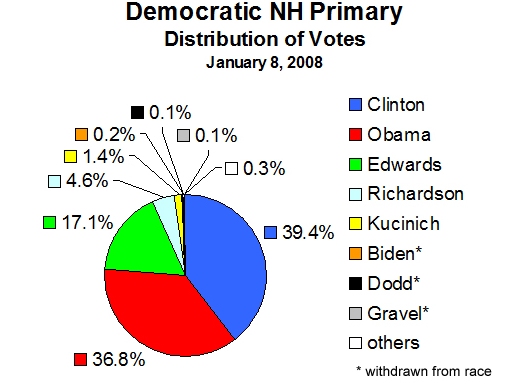
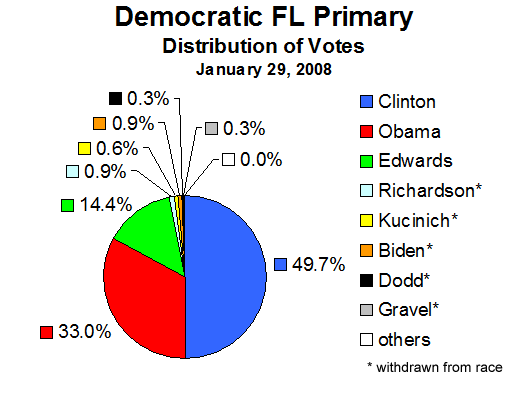
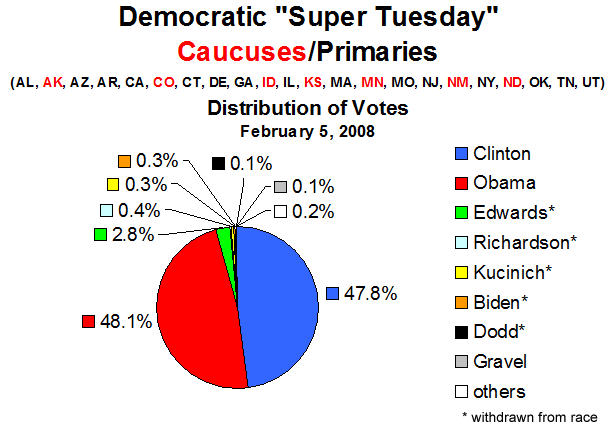
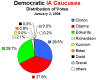
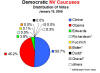
Democratic Caucuses/Primaries
Overall

By State Groupings

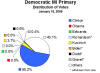
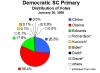


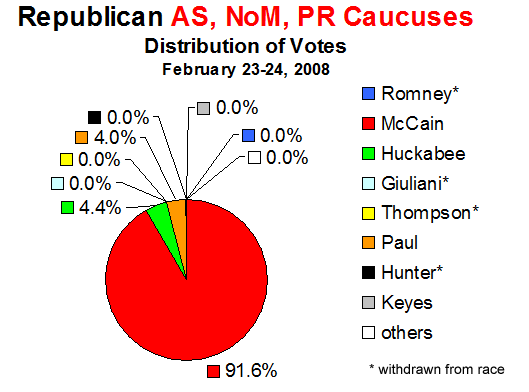
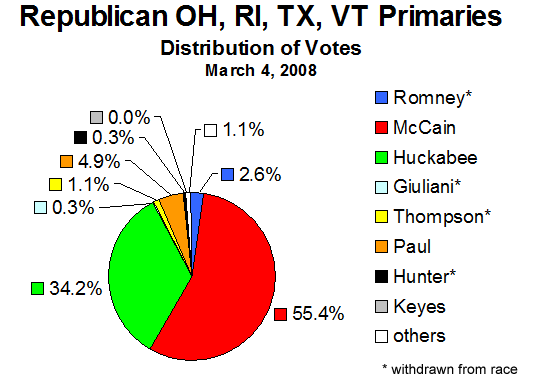
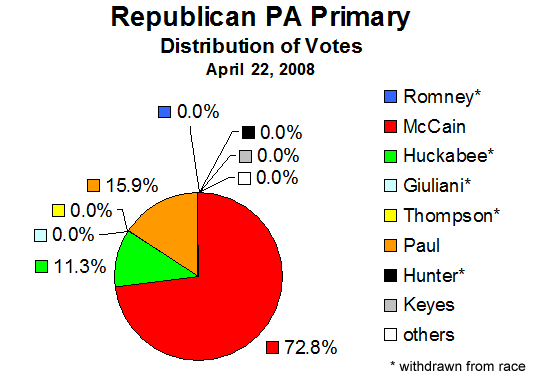
Republican Caucuses/Primaries

Overall
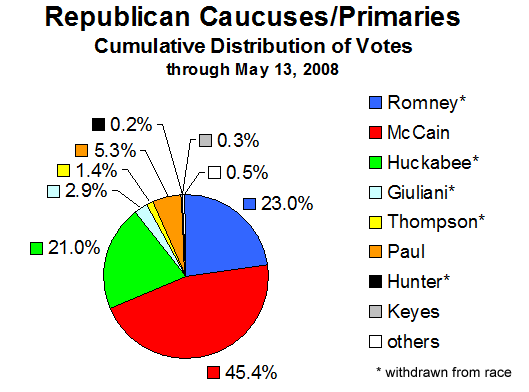
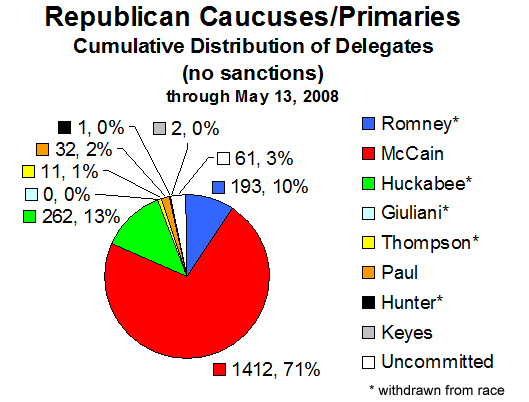
By State
Groupings


THE LAST WEEKLY TRACKING POLL MAPS!
½ Week of November 1-3
This appears to be the final take on pre-election polling for 2008.
Changes from three days ago include a weakening of Obama's numbers in
Minnesota (now merely leaning Obama), and tightening of the polls in Ohio,
Virginia, and Florida. Polls have McCain up by 0.4% in North
Carolina, which would mean an upward trend for McCain there. McCain
maintains a tenuous hold on Missouri, Indiana, Georgia, Montana, North
Dakota, and Arizona. Of the six, Missouri is the weakest as he
maintains only a 0.7% lead there. If this pattern holds, Barack Obama
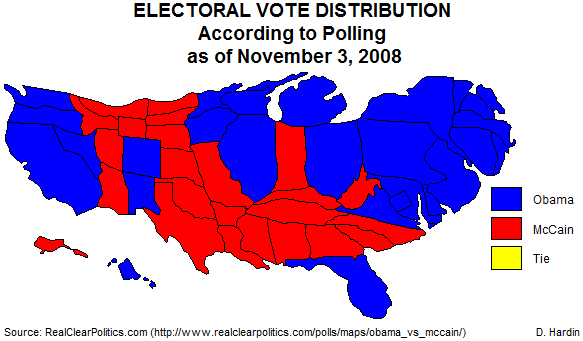
will win by 338 to 200.
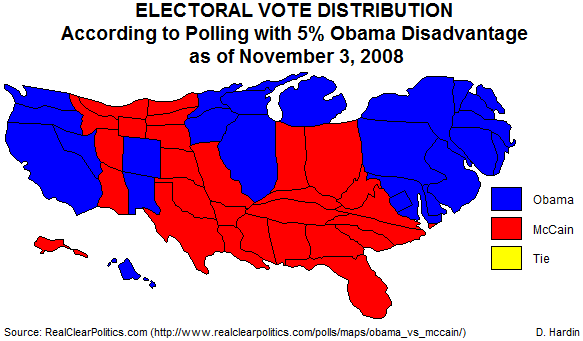
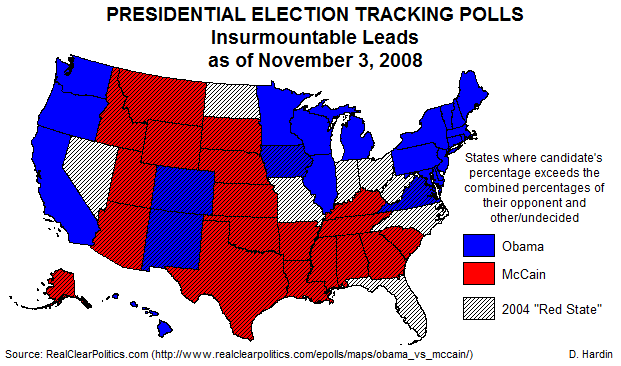
Even if a five percentage point disadvantage is factored into Obama's
numbers (see the map below), he still will win 278 to 260. The vast
majority of states also now have such low levels of "undecided" (see the map
below) that enough "insurmountable" electoral victories (286; see the map
below) will go to Obama. Of course, this is all based on polling, so that
might be wrong.
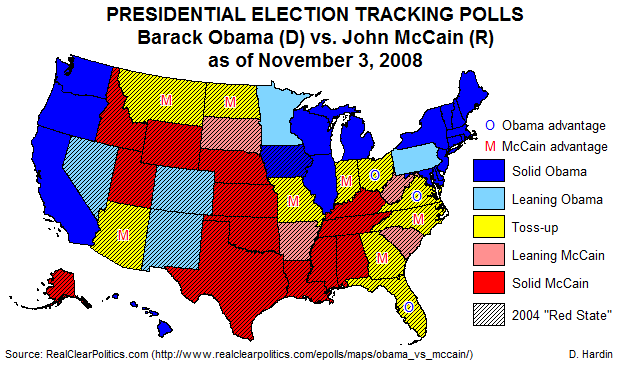
Obama 278
McCain 132
Toss-up
128
Without Toss-ups:
Obama 338
McCain 200
If the Election Were Held Today. . .
Bradley/Wilder Effect?
Race Factored into the 2008 Electoral
Map
Now call me a pessimist (or an optimist, depending
on your political orientation), but experience with the 1989 Wilder election in
Virginia leads me to believe that most national and state polls must
factor in a five percentage point disadvantage for Obama. Polls in Virginia
prior to the gubernatorial election of 1989 had Doug Wilder up as much as ten
percentage points over his Republican rival Marshall Coleman. Wilder
became America's first African-American governor by a margin of 6,800 votes -
0.38 percent of the votes cast. Obviously, ten points predicted in polling
and 0.38 percent in the actual outcome raised the specter that in face-to-face
and phone polling, respondents were reluctant to say they were not going
to vote for Wilder when they stepped into the private confines of the voting
booth. As a result, Wilder's numbers in predominantly white districts was
overrepresented in the polling data. In exit polling, twenty-one percent
of Coleman's voters cited Wilder's race as a reason they voted for Coleman or
against Wilder, so we know race definitely was a factor in Wilder's
narrower-than-expected victory. The likelihood that this is not
happening a mere nineteen years later for the first African-American
presidential candidate seems absurd to me. A recent Stanford University
study has concluded that the rate of deception over race in opinion polling is
six percent. Others have put that number at two or three points. I
stand with my five point deduction in Obama's numbers. As a result, the tracking poll map below takes on a much
different look than the one above.
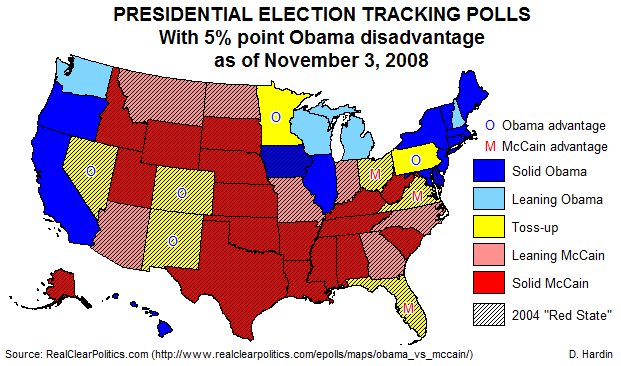
Obama 228
McCain 200
Toss-up
110
Without Toss-ups:
Obama 278
McCain 260
If the Election Were Held Today. . .
What's the level of uncertainty?

Dr.
Hardin's
Usually Incorrect Presidential Election Prediction
OK, so my
track record is pretty lousy and I have in the past sworn off predictions.
Nonetheless, here goes. . .
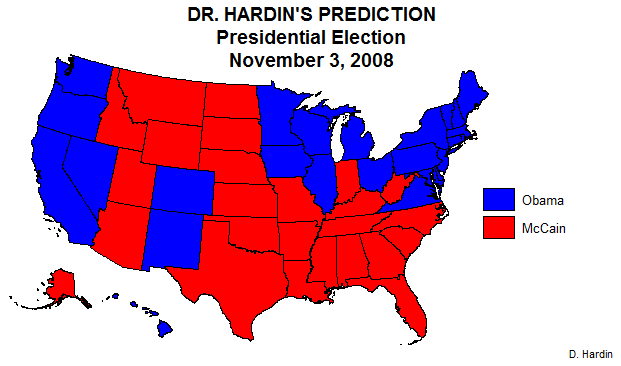
Obama 311
McCain 227
I am
predicting that Barack Obama will defeat John McCain 311 to 227 electoral
votes. My prediction is based on a compromise between the latest
polling averages provided by RealClearPolitics.com and the most pessimistic take
on the polls, which factors in a five percentage point disadvantage for Barack
Obama (see the maps above). As it stands now, in either scenario Obama
beats John McCain 338 to 200 or 278 to 260 respectively. In that case, we're
only arguing about which "Red States" Obama can take. My scenario is based
on a 2.5 percentage point discounting of Obama's polling numbers. With that
factored in, the only states that are in play are Ohio, Virginia, North
Carolina, and Florida. My prediction has Obama winning in Virginia and
Ohio but losing North Carolina and Florida. Obama has an insurmountable
lead in Virginia, although weather may be a factor. By my calculation,
Ohio may be tied, but I think Obama will win the state. McCain now is
slightly ahead in North Carolina; with
2.5 percentage points taken from Obama, McCain will win North Carolina. At
least I think that's how it will work out, if only because it's just too much to
hope that both Virginia and North Carolina could go to a Democratic presidential
candidate. A coastal storm will hit the Carolinas and southeastern
Virginia on election day, which may suppress the voting of unenthusiastic rural
and suburban McCain supporters. Of course, it also could affect the Obama
vote in urban Hampton Roads, which is crucial to his winning Virginia.
Florida has Obama up by 1.8 percentage points, so the 2.5 percentage point
deficit tips Florida to McCain. A great unknown is the early voting in
Florida, North Carolina, and Virginia ("early absentee"). Large numbers of early voters who predominantly
have identified themselves as Democrats or Obama voters may result in Obama
upsets in Florida and North Carolina and a strong win in Virginia. What could make
my prediction wildly wrong again? The same thing that happened in 2004:
young voters failed to show up at the polls in 2004 and could do so again. In 2004
I got the outcome wrong because in crucial states - most notably Ohio - 18-24
year olds did not come out and vote for Kerry. The Obama campaign has
worked the youth vote like no other campaign ever has. Organizing young
voters won them crucial caucuses and by using the Internet and texting in an
energetic way, Obama may actually do what hasn't been managed before.
Also, early voting favors the young, who are not only able to but also willing
to wait in multi-hour lines. If they have voted early, Obama may already
have won. If young voters do not come out - and they are the least
dependable demographic - the value of the elderly vote increases considerably.
The extent to which hours-long lines in early voting dissuaded older voters is
unknown. Keep in mind, though, that long lines have been a problem in
states with Republican controlled state election boards. In that
case they would have nobody to blame but themselves if the elderly don't get out
and vote for McCain. None of that matters, of course, if the Washington
Redskins lose their home game against the Pittsburgh Steelers on November 3.
Seeing as how they're playing, I don't have much confidence that the
Redskins will beat the Steelers, which legend has it would favor the party out
of power (Democrats). But come to think of it, that didn't work out in
2004.
UPDATE:
The Pittsburgh Steelers beat the Washington Redskins 23 to 6 on Monday night; the
election therefore is a done deal for Barack Obama!
Created
November 3, 2008
Updated
November 4, 2008
How
Did I Do?
I went
with my most pessimistic projection for the presidential election outcome.
I in fact had made three maps of the potential outcome: one for the most
optimistic outcome, the outcome predicted by polling, and my pessimistic 2.5
percentage point Obama disadvantage map. What happened was that Obama won
in an electoral landslide that exceeded the expectation of national polling and
turned out to exactly fit my most optimistic map. I conservatively kept
Indiana, North Carolina, and Florida in McCain's column, which would have led to
a 311-227 Obama victory. Of course, Obama won all three states and ended
up winning by a commanding 365-173.
Created
November 20, 2008
Updated January 6, 2009